Main Marketing Channels of IT Services Companies in 2025
The IT services market has become a powerful force in driving digital transformation, characterized by an extremely competitive and dynamic environment. To remain visible in the market, selecting the right marketing channel has become more than a strategic decision – it's necessary for IT service providers aiming to survive.
For the second year, Techreviewer has conducted an in-depth survey titled Main Marketing Channels to identify the most effective methods for digital marketing for IT companies. You can review the previous research here: Main Marketing Channels Survey 2023.
Our primary objectives are:
- To understand which channels IT services companies use to attract customers in 2025.
- To assess the effectiveness of these channels.
- To identify trends and the current market landscape.
Additionally, we asked companies about their marketing budgets, client acquisition challenges, perceived threats in 2025, and their plans for the year.
With contributions from companies across the globe – from North America to Southeast Asia – this report serves as a data-based overview of the IT services market.
This report promises a wealth of knowledge, whether you're a marketing specialist, a firm stakeholder, or an industry analyst.
Participants overview
Sixty-two companies participated in the survey, providing a comprehensive and diverse perspective on the current state of marketing in the IT services sector. The participant pool included IT service providers from various regions across the globe, ensuring a broad representation of market trends and challenges.
Company size

- The majority of participants (71.5%) are companies with fewer than 100 employees. These are small-to medium-sized service providers that represent the majority of the market.
- 21% of respondents have between 100 and 249 employees, representing mid-sized organizations that are likely scaling their operations and expanding their client base.
- 6.5% have between 250 and 999 employees, indicating larger service providers with more complex service structures and potentially international reach.
- Only 1.6% of respondents have more than 1,000 employees. These are established market players that likely offer enterprise-level services.
The distribution suggests that the market is presented mainly by small to mid-sized providers, with a balanced presence of companies that offer complex and large projects.
Company location

- Europe leads the representation with 38.3% of respondents, driven predominantly by Poland (11.3%) and Ukraine (6.5%), along with Romania, the Czech Republic, Lithuania, Latvia, Serbia, Kosovo, Ireland, and Germany.
- Asia is second with 36.7%, driven predominantly by India, which alone accounts for 24.2% of participants. Other Asian countries include Bangladesh, Pakistan, UAE, Vietnam, Armenia, and Cyprus, with the UAE contributing 5%.
- North America accounts for 23.4% of participants, with the USA at 16.1% and Canada at 6.5%.
- Latin America, with 3.4%, includes Mexico and Uruguay.
- The last is Africa, represented solely by Egypt, which comprises 1.6% of respondents.
The strong presence of Asia, particularly India, underscores the region's cost efficiency and established role in the IT services market. The presence of Europe and North America shows that the market is focused on quality and innovation, with strong support from the education system, balancing the low-cost Asia region.
Target location

- 77.4% of respondents prioritize the North American market, which has remained the dominant target region over the years.
- Europe is a strong secondary focus with 59.7% of companies targeting this mature market.
- 27.4% of IT providers target the Middle East, possibly driven by digital transformation and government-led tech initiatives in countries like the UAE and Saudi Arabia.
- 25.8% of companies target Australia and New Zealand.
- 17.7% prioritize South Asia, including countries like India, Pakistan, and Bangladesh. These are probably local service providers that offer onshore development.
- 17.7% target Latin America, looking for opportunities in countries like Brazil and Mexico.
- 11.3% target Southeast Asia, which is represented by Singapore, Malaysia, Thailand, and the Philippines.
- East Asia accounts for 6.5% of the total, with countries including China, Japan, and South Korea. The interest in this region is limited due to the language barriers or a preference for other markets.
- 8.1% consider Africa a target region.
Key trends:
North America and Europe dominate as the top target regions. These are established markets with effective economies that consistently demonstrate high demand for IT services.
Types of customers

This chart reveals the distribution of customer types IT service providers attract through their primary marketing channels.
- Medium-sized businesses are the most targeted, with 88.7% of respondents focusing on this segment.
- Small businesses follow closely, with 77.4% of respondents targeting them.
- Startups are a focus for 53.2% of respondents (33 out of 62).
- Lastly, 43.5% of respondents target enterprises.
This distribution demonstrates that the IT service providers emphasize small to medium-sized businesses.
Price range

- <$20/hour (6.5%): Low-cost providers, often located in regions with lower operational expenses. These companies usually provide services to cost-sensitive clients such as startups or small businesses.
- $20–$29/hour (17.7%): A company that offers a better expertise-cost ratio but still refers to low-cost solutions.
- $30–$49/hour (35.5%): This is the largest segment, representing mid-range providers that offer an optimal balance between cost and quality.
- $50–$99/hour (30.6%): Positioned in the upper-middle tier, these firms cater to clients who prioritize higher quality, domain specialization, or more experienced teams.
- $100–$149/hour (3.2%): A smaller, premium category representing firms that offer consulting or enterprise-level support.
- $150–$199/hour (4.8%): A niche segment serving complex or high-risk projects, often requiring deep specialization in some specific field.
- >$200/hour (1.6%): The rarest category, typically composed of elite consulting firms.
Types of services

The survey also highlights the types of services offered by IT providers.
- Outsourcing + Staffing (53.2%): The largest segment combines both outsourcing and staffing services. Providers strive to offer flexible service models to cover different client needs.
- Outsourcing only (40.3%): A significant portion of providers focus solely on outsourcing, offering end-to-end project execution.
- Staffing only (6.5%): The smallest group delivers staffing services exclusively.
Marketing channels
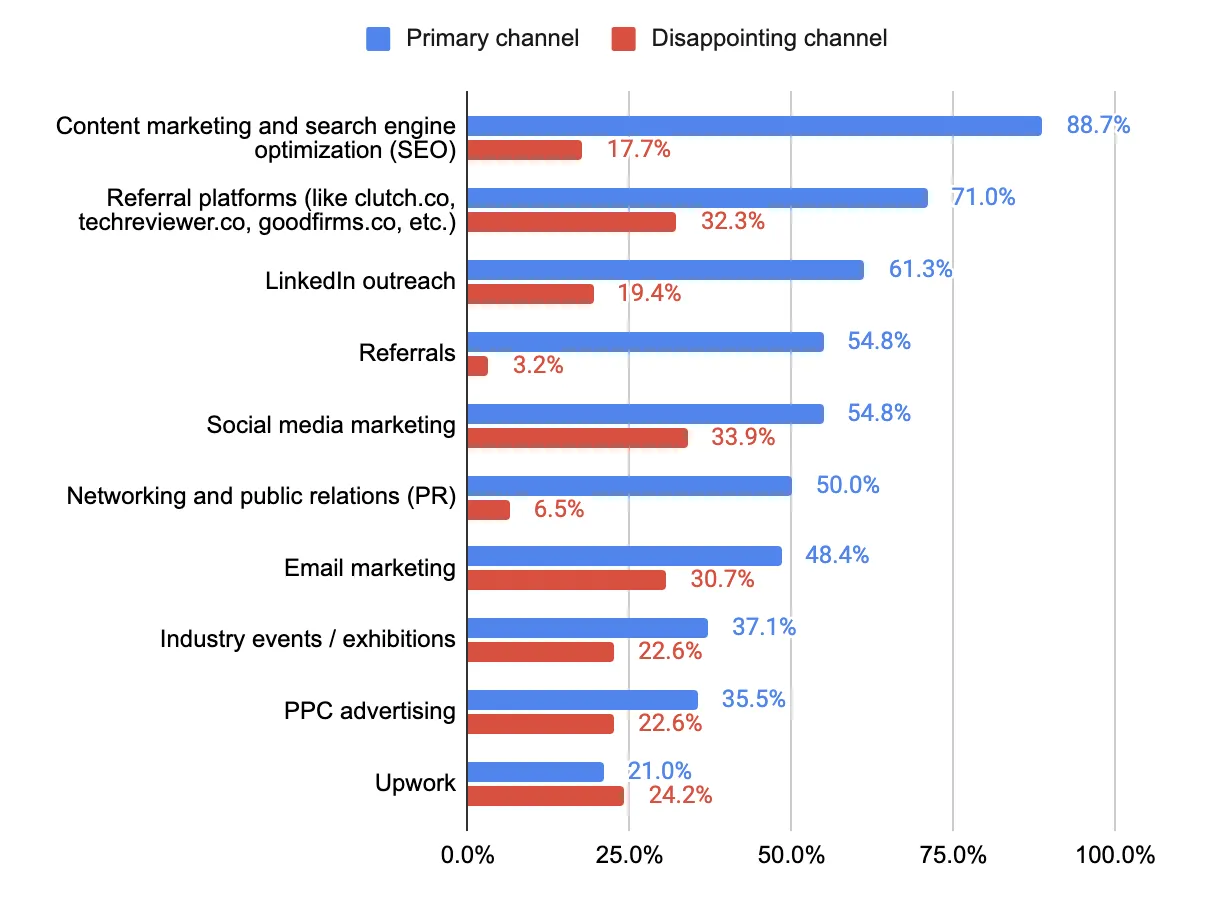
Primary channels

The survey identifies the primary marketing channels IT service providers use to attract customers.
- Content marketing and SEO (88.7%): The most widely used and well-known marketing channel that remains the most effective and stable lead generator from the respondents' perspectives.
- Referral platforms (71%): A strong second that includes cooperation with platforms like Clutch, Techreviewer, and GoodFirms.
- LinkedIn outreach (61.3%): A channel that implies reaching decision-makers through professional networking.
- Referrals (54.8%): A method that implies encouraging clients to provide recommendations to their network.
- Social media marketing (54.8%): Equally prominent, highlighting the role of social platforms in driving engagement and awareness.
- Networking and PR (50%): Half of the respondents rely on relationship-driven outreach and building a strong network of contacts.
- Email marketing (48.4%): A classic way of reaching new clients that is still relevant.
- Industry events and exhibitions (37.1%): This channel offers credibility and face-to-face interaction, but is less relied upon overall.
- PPC advertising (35.5%): Paid search and display campaigns see moderate usage, often as part of broader marketing strategies.
- Upwork (21%): The least used channel, typically suited for freelance-oriented work.
Most effective marketing channels

This chart reflects the effectiveness of marketing channels over the previous research year.
- Content marketing and SEO (69.4%): Highly effective, dominant strategy for visibility and lead generation.
- Referrals (45.2%): Strongly effective, leveraging trust through personalized recommendations.
- Referral platforms (40.3%): Notably effective, allowing to build trust and credibility mong clients.
- LinkedIn outreach (35.5%): Moderately effective.
- Networking and PR (30.6%): Moderately effective, supporting relationship-building efforts.
- Email marketing (29.0%): Moderately effective, useful for personalized outreach.
- Industry events (24.2%): Limited effectiveness, valuable for in-person engagement.
- PPC advertising (24.2%): Limited effectiveness, probably because of the high client acquisition cost.
- Social media marketing (24.2%): Limited effectiveness, contributing to brand visibility.
- Upwork (8.1%): Minimally effective, showing low impact in this sector.
- Word-of-mouth (WOM) marketing (1.6%): Some respondents distinguished this from referrals, considering this channel the most effective.
Key trends:
Content marketing and SEO stand out as the most effective channels, while referrals and referral platforms also perform strongly by leveraging trust.
Moderate effectiveness in LinkedIn outreach, networking/PR, and email marketing highlights their value in personalized and professional engagement. However, industry events, PPC advertising, and social media show limited impact, with PPC possibly hindered by high acquisition costs.
Upwork and WOM marketing have minimal influence, though some view WOM as highly effective when distinguished from referrals.
Channels have not lived up to companies' expectations

This chart explores which marketing channels have not met expectations over the previous research year.
- Social Media Marketing (33.9%): Highest underperformance, likely due to challenges in organic reach or targeting.
- Referral Platforms (32.3%): Notably disappointing, suggesting variability in effectiveness.
- Email Marketing (30.6%): Notably underperformed, possibly due to challenges in increasing open rates or overcoming spam filters.
- Upwork (24.2%): Moderately disappointing, reflecting mixed results from freelance platforms.
- Industry Events (22.6%): Moderately underperformed, indicating inconsistent in-person impact.
- PPC Advertising (22.6%): Moderately disappointing, possibly due to high client acquisition costs or issues with setting the proper targeting.
- LinkedIn Outreach (19.4%): Somewhat underperformed, despite its professional focus.
- Content Marketing and SEO (17.7%): Relatively disappointing for some companies.
- Networking and PR (6.5%): Rarely underperformed, showing strong reliability in relationship-building.
- Referrals (3.2%): Least disappointing, underscoring trust-based effectiveness.
Comparison with the main marketing channels
- Content marketing and search engine optimization (SEO): With 88.7% usage, it is the most adopted channel, yet 17.7% found it disappointing, suggesting that while widely used, the effectiveness of this channel varies.
- Email marketing: Adopted by 48.4%, it shows serious underperformance, with 30.7% of respondents unsatisfied with the results.
- Industry events/exhibitions: 37.1% used them, but 22.6% of respondents were unsatisfied with the results. The outcomes from in-person networking are questionable, possibly influenced by high travel costs, attendance quality, or a low contact-to-lead ratio.
- LinkedIn outreach: With 61.3% usage, 19.4% dissatisfaction was recorded, suggesting moderate effectiveness despite its popularity.
- Networking and Public Relations (PR): Adopted by 50.0%, it had one of the lowest disappointment rates at 6.5%, indicating high reliability and trust in relationship-building efforts.
- PPC Advertising: Used by 35.5%, it disappointed 22.6%, showing a close alignment between usage and underperformance, possibly due to rising ad costs or targeting inefficiencies.
- Referral Platforms (like Clutch.co, techreviewer.co, goodfirms.co, etc.): With 71.0% adoption, 32.3% found them unsatisfying. The gap is likely derived from the high costs of advertising on these platforms, with inconsistent results.
- Referrals: Utilized by 54.8%, it had the lowest disappointment rate at 3.2%, reinforcing its effectiveness as a trust-based channel.
- Social Media Marketing: Adopted by 54.8%, it disappointed 33.9%, demonstrating a significant gap in efforts and results, probably due to audience saturation.
- Upwork: With 21.0% usage, it underperformed by 24.2%, showing a higher dissatisfaction rate than adoption. This channel was the most ineffective for the respondents in the previous research year and even before that.
Key trends in marketing channels:
- Content marketing and SEO as a cornerstone strategy: With the highest adoption rate (88.7%) and effectiveness (69.4%), content marketing and SEO dominate as the most reliable and stable lead generators. 17.7% dissatisfaction indicates variability in results. However, it remains the most stable channel for driving qualified leads.
- Trust-based channels excel: Referrals (54.8% usage, 45.2% effective, 3.2% disappointing) and networking/PR (50.0% usage, 30.7% effective, 6.5% disappointing) stand out with a high satisfaction ratio and a low disappointment level. Trust and relationships align with such a purchase factor as brand reputation. The low disappointment rates of these channels make them critical for differentiating company offerings, especially for SMEs.
- Referral platforms show mixed results: Referral platforms like Clutch.co, Techreviewer, and goodfirms.co are widely used (71.0%) and notably effective (40.3%), but their high dissatisfaction rate (32.3%) highlights inconsistent outcomes, likely due to high advertising costs and variable lead quality. Providers should evaluate platform ROI and focus on those delivering consistent results.
- Social media and email marketing underperform expectations: Social media marketing (54.8% usage, 24.2% effective, 33.9% disappointing) and email marketing (48.4% usage, 29.0% effective, 30.7% disappointing) show significant gaps between adoption and results. Both channels have significant challenges to overcome, like audience saturation with social media channels or low open rates in email marketing.
- PPC and industry events are seriously underperforming: PPC advertising (35.5% usage, 24.2% effective, 22.6% disappointing) and industry events (37.1% usage, 24.2% effective, 22.6% disappointing) underperform relative to their adoption. Providers should optimize targeting and event selection to improve ROI.
- LinkedIn outreach offers moderate value: This channel (61.3% usage, 35.5% effective, 19.4% disappointing) provides moderate effectiveness, benefiting from its professional focus but falling short for some due to saturation or targeting issues.
- Upwork demonstrates the poorest results: Upwork (21.0% usage, 8.1% effective, 24.2% disappointing) consistently underperforms, with dissatisfaction outpacing usage. It seems like Upwork fails to address market needs and can't serve as a reliable source of new clients.
Strategic recommendations
- Optimize high-performing channels: Content marketing/SEO and trust-based channels (referrals, networking/PR) should be refined since they proved to be the most effective.
- Reassess referral platforms and industry events: Look for referral platforms with proven ROI and prioritize high-quality industry events to maximize impact. These channels show mixed performance and should be carefully evaluated before further investment.
- Reassess your LinkedIn strategy: Only half of the respondents who use LinkedIn as a main marketing channel are satisfied with the results. So, continuing to invest in this channel is a wise investment if it's already performing well. Otherwise, reassess your LinkedIn strategy to avoid the risk of getting low ROI.
- Reconsider the strategy with other channels: Social media, email, and PPC have demonstrated highly inconsistent results with relatively low effectiveness. Still, these channels attract high investments, so consider examining the latest trends, best practices, and new ways to improve their effectiveness.
Comparison: Main marketing channels (2023 vs. 2025)

Key trends
Thanks to the annual nature of this research, we can see the dynamics of the respondents' answers. And here is what we see:
Shifts in primary channel usage
- Increased adoption: PPC advertising saw the largest increase in usage, rising by 11.3 percentage points from 24.2% to 35.5%. Even though the effectiveness of this channel remains questionable, this trend indicates that companies still rely on paid digital campaigns, possibly because it remains the quickest way to get new leads. Networking and PR also increased by 7.6 points from 42.4% to 50.0%, indicating a renewed focus on relationship-building. Content marketing and SEO saw a modest rise of 3.9 points (84.8% to 88.7%), asserting its dominance.
- Decreased adoption: Referral platforms experienced the most significant drop, falling by 13.8 points from 84.8% to 71.0%, possibly due to inconsistent results as reflected in the disappointment rates. Social media marketing and referrals both declined by 8.8 points (63.6% to 54.8%), reflecting a shift away from these channels, likely due to challenges in scalability or effectiveness. Email marketing and industry events saw smaller declines of 6.1 and 2.3 points, respectively.
Changes in disappointment rates:
- Rising disappointment: Social media marketing saw the most significant increase in disappointment (18.7 points from 15.2% to 33.9%), highlighting growing challenges of getting results with these channels, probably due to audience fatigue. Referral platforms and industry events saw slight increases in disappointment (1.96 and 1.38 points, respectively), which perfectly aligns with their reduced adoption rate.
- Decreased disappointment: Networking and PR showed the largest improvement, with disappointment dropping by 8.7 points (15.2% to 6.5%), highlighting the significant role of trust-based channels. Email marketing disappointment decreased by 5.75. Let's compare it with the corresponding drop in the adoption rate. It makes sense: companies that fail to implement proper email marketing stop investing in this channel, so the disappointment drops. SEO and content marketing, referrals, and PPC advertising saw smaller, insignificant improvements of 3.46, 2.87, and 1.62 points, respectively.
Overall insights:
While PPC advertising and networking/PR experienced the most notable increases in adoption, their effectiveness remains mixed. Companies still rely on quick-win tactics like paid campaigns and relationship-based outreach. At the same time, content marketing and SEO continue to solidify their role as the foundational strategy.
The drop in disappointment for networking/PR and email marketing suggests a profound shift in companies' strategies toward relationship-oriented methods.
This analysis highlights a strategic pivot in 2025 toward channels that offer reliability (e.g., networking/PR, referrals) or measurable ROI (e.g., PPC advertising), while providers move away from channels with inconsistent results (e.g., social media, referral platforms).
IT marketing budget
Factors that influence purchase decisions

This chart examines the factors influencing customers' purchase decisions from the perspective of IT services providers in the IT industry.
- Expertise (85.5%): The top decision-making factor. Respondents believe that clients prioritize technical skill and industry knowledge above all.
- Quality (82.3%): A close second, showing that benchmarks and quality standards matter.
- Price (71.0%): The third factor, but still a major one. However, we see the value-over-price mindset among IT service providers, which means they likely use the strategies to improve quality and expertise over pricing strategies.
- Brand reputation (46.8%): The fourth factor that lags behind the top 3, but is still relevant.
- Relationship with vendor (40.3%): Moderately important, highlighting the role of partnership in the cooperation.
- Features (35.5%): Moderately important, refers to the list of features the IT service provider offers.
- Scalability (29.0%): Moderately important, relevant for businesses with growth plans.
- Customer Reviews (27.4%): Respondents consider customer reviews unimportant.
- Social Proof (24.2%): Underscores the impact of credibility signals, such as client logos, media mentions, or case studies.
- Customer Support (21.0%): The least cited factor, which means that good customer support is expected by default rather than being a unique selling offering.
Additional Insights:
- We see an evident shift toward expertise and quality as the top buying factors, while costs remain the top three factors. This means that we are in the market with a value-over-price mindset rather than the opposite.
- The moderate importance of features and scalability reflects a maturing market where clients seek adaptable and customized solutions.
Recommendations for IT services companies:
- Showcase technical capabilities through visible proof like certifications, successful complex projects, or niche expertise.
- Offer pricing that reflects value and allows your team to grow as professionals while remaining competitive for cost-conscious buyers.
- Build a recognizable and trusted brand presence by maintaining clear messaging and consistently delivering top-tier services.
- Adapt services to specific, narrow client needs and become experts in them.
- Collect and share positive client feedback to reinforce credibility and influence new prospects.
Comparison: factors influencing purchase decisions (2023 vs. 2025)
Current market state
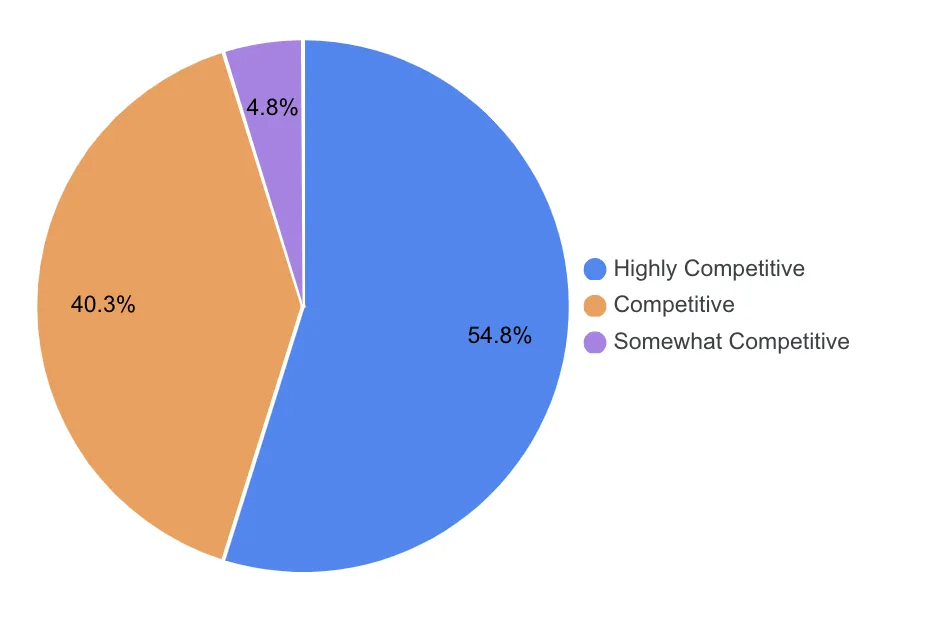
This question provides insights into how respondents see the current competitive landscape in the market.
- Highly competitive (54.8%): The majority describe the market as intensely competitive, which implies a strong rivalry among providers.
- Competitive (40.3%): A significant number of respondents consider the environment challenging but with manageable competition.
- Somewhat competitive (4.8%): A small minority perceives the market as less aggressive and easy to navigate.
95% of all respondents recognize the market as competitive, while the dominance of "highly competitive" highlights that companies need to push their efforts toward winning new clients, probably by differentiating their offerings, using technological advancements, or advancing their expertise.
Comparison: competitive landscape (2023 vs. 2025)

The comparison between 2023 and 2025 reveals a significant shift in the perceived competitive landscape within the IT services market. The drop appears to have shifted toward the "competitive" category, which grew by 19.1 percentage points, rising from 21.2% in 2023 to 40.3% in 2025. That means the pressure remains, but providers have started considering the environment more manageable.
The percentage of respondents who see the market as "somewhat competitive" remains low, with an insignificant decrease of 1.3 points from 6.1% in 2023 to 4.8% in 2025.
No companies described the competitive landscape as "not competitive" during both years of the survey, suggesting that all companies in the market face some degree of competition.
The biggest challenges in attracting new customers

This chart examines the biggest challenges companies face when attracting new customers.
- Dominant challenges: Generating leads tops the list at 54.8%, indicating a significant challenge to even initiate cooperation. The long sales cycle, affecting 50.0%, is the second challenge. This is a common situation in IT services, where clients prolong decision-making because they compare different vendors and check their diligence.
- Competitive pressures: Competition concerns 43.5% of respondents, aligning with the "highly competitive" market perception (54.8% in 2025). Differentiating the company from other providers and the high cost of customer acquisition are at the same level of 32.3%, implying difficulties in finding the company's unique market position.
- Conversion and awareness issues: Closing deals and lack of brand awareness each impact 29.0%, pointing to challenges in converting leads into clients and building market visibility. Keeping up with the latest technology trends is the least cited challenge at 8.1%, suggesting that most providers feel confident about adopting new technologies.
Key trends
- The high percentages for generating leads, long sales cycles, and increasing competition indicate a market where demand exists but is difficult to capture due to time, cost, and rivalry. This insight aligns with the previous discovery about the role of expertise and quality as purchase factors, as providers are pushing their expertise to stand out among competitors.
- The challenge of lead generation and long sales cycles suggests that IT vendors should look for effective IT marketing strategies.
- This analysis reveals that IT service providers in 2025 face significant barriers in initiating customer relationships and converting leads into clients, driven by a competitive environment and the challenge of differentiating the company's offerings.
Comparison: challenges in attracting new сustomers (2023 vs. 2025)
Significant decreases in key challenges:
- Generating leads: The most notable shift is a 26.96 percentage point decrease, from 81.8% in 2023 to 54.84% in 2025. This suggests that lead generation strategies are improved, or the existing strategies become more effective.
- Long sales cycle: There is a moderate shift of 13.6 points from 63.6% to 50.00%, indicating a shortening of sales cycles and the increased readiness for clients to buy services.
- Lack of brand awareness: A 13.4-point decrease from 42.4% in 2023 to 29.0% in 2025 signals that IT services providers have successfully developed strategies to improve their brand visibility from the previous research year.
Stable or minor changes
- Increasing competition: A modest decrease of 4.95 points implies that the market entered a less competitive landscape in 2025 compared to the previous research year.
- High cost of customer acquisition: A slight increase of 1.96 points indicates a persistent concern about customer acquisition cost. Notably, that's the only challenge that increased this year.
- The rest of the challenges saw minor decreases of less than 5 points, implying that the overall market situation tends toward improving.
Key trends:
- The 2023-2025 comparison shows a positive trend in customer acquisition, with significant improvements in lead generation, sales cycles, and brand awareness.
- However, the rising cost of customer acquisition highlights the need for cost-effective strategies.
Interconnected trends:
- The significant reduction in lead generation challenges aligns with budget allocation trends, where 88.71% of respondents allocate their budget to content marketing and SEO, likely improving lead pipelines. However, the slight rise in customer acquisition costs with a decrease in lead generation challenges indicates that while leads are easier to generate, converting them remains expensive.
- The decrease in long sales cycles and lack of brand awareness challenges correlates with the increased importance of expertise (85.48%) and brand reputation (46.77%) as purchase factors in 2025, suggesting that stronger branding and credibility are accelerating sales processes.
The current state of the IT services market

This chart examines how respondents see the current state of the IT services market.
- Dominant market characteristics: 71.0% of respondents see the market as "growing and competitive. "Rapidly changing and innovative follows at 61.3%, implying that the market is considered to be dynamic and shaped by technology. Data-driven and AI-powered is the third closest, with 51.6%, highlighting the modern impact of data and artificial intelligence.
- Secondary characteristics: "Customer-centric and outcome-driven" and "fragmented and complex" each account for 21.0%. "Security-conscious and compliant" affects 19.4%, highlighting rising concerns about cybersecurity, while "disruptive and transformative" is cited by 16.1% (10 out of 62). Only 1.6% (1 out of 62) describe it as "consolidating and maturing," showing minimal perception of market stabilization.
Key trends:
- The "growing and competitive" perception ties to the challenges of increasing competition (43.55%) and generating leads (54.84%), suggesting that significant hurdles accompany growth opportunities.
- The emphasis on "rapidly changing and innovative" (61.29%) and "data-driven and AI-powered" (51.61%) aligns with the low concern about keeping up with technology trends (8.06%), indicating that providers are adapting to these shifts.
- The dominance of growth, innovation, and data-driven characteristics suggests a dynamic market with opportunities for providers who can leverage technology and differentiation.
Comparison: current state of the IT services market (2023 vs. 2025)

The year-over-year comparison reveals significant shifts in the perceived state of the IT services market:
- Increased growth and competitiveness: The "growing and competitive" perception rose by 13.4 percentage points, from 57.6% in 2023 to 71.0% in 2025. This aligns with the earlier competitive landscape findings, where "highly competitive" perceptions decreased (72.7% to 54.8%), suggesting that while competition remains intense, the market's growth is more prominent, offering great opportunities for expansion.
- Decline in customer-centric focus: We observe the most significant drop in market perception as "customer-centric and outcome-driven," falling 21.4 points from 42.4% to 21.0%.
- Decreased security and compliance concerns: "Security-conscious and compliant" perceptions decreased by 11.0points from 30.3% in 2023 to 19.4% in 2025, suggesting reduced concern about compliance and security issues.
- Technology-driven: "Rapidly changing and innovative" and "data-driven and AI-powered" characteristics saw minor decreases of 2.3 and 2.9 points, respectively, remaining the top 3 factors defining the IT market state. Still, these changes are manageable, which is backed by the fact that the "Disruptive and transformative" market perception saw a very slight increase of 0.93 points, remaining the penultimate market characteristic.
- Highly dynamic market: "Consolidating and maturing" fell by 4.49 points to just 1.61%, reinforcing that the market is far from mature, with growth and innovation dominating.
Strategic recommendations:
- IT service providers should capitalize on the market's growth by expanding their offerings and targeting emerging needs and business models.
- Continued investment in innovation and AI can help providers stay ahead of the competition, allowing them to keep up with the rapidly changing and data-driven market.
Marketing plans
Channels companies plan to invest in

This chart displays the channels that the IT service providers plan to invest in 2025.
Top 1
- Content marketing and SEO (64.5%): The leading priority with a significant gap from the second place. This channel works as a stable lead generator.
Middle priorities (35%-45%)
- LinkedIn outreach (45.2%): The top 2 channels that companies plan to use to attract new clients. They plan to use professional networking for B2B engagement.
- PPC advertising (41.9%): PPC will remain the priority for quick lead generation, despite limited effectiveness (24.19%).
- Industry events/exhibitions (40.3%): Another valued channel despite inconsistent impact (22.6% disappointing). It means that the companies plan to invest in in-person engagement and credibility, focusing on relationship building with clients.
- Referral platforms (like Clutch.co, techreviewer.co, etc.) (38.7%): A notable investment in the referral platforms despite high dissatisfaction (32.3%).
- Networking and public relations (PR) (37.1%): This is a moderate investment into trust-based outreach, supported by low disappointment (6.5%) and moderate effectiveness (30.7%).
Low priorities (below 35%)
- Social media marketing (30.7%).
- Email marketing (27.4%).
- Referrals (16.1%).
- Upwork (11.3%).
The biggest threats in the next year

This chart examines threats that respondents anticipate in 2025.
- Economic recession is the dominant threat, cited by 64.5% of respondents, reflecting widespread uncertainty about the global economic environment.
- Competitive and cost pressures: New competitors entering the market and rising labor costs concern 27.4% of companies. The fear of new entrants is logically derived from the market's competitive landscape (54.8% highly competitive). At the same time, rising labor costs may strain margins, especially considering the challenge of the high cost of customer acquisition.
- Talent threat: Increased customer churn affects 21.0%, indicating talent retention issues. On the other hand, skills shortage remains at approximately the same level of 17.7%, reflecting ongoing talent gaps. Loss of key employees is the least cited threat at 4.8%, indicating relative stability in core company offering.
- No threats: Notably, 16.1% report no perceived threats, suggesting confidence among some providers in their marketing position and offerings.
This analysis highlights economic recession as the primary threat in 2025.
Comparison: the biggest threats (2023 vs. 2025)
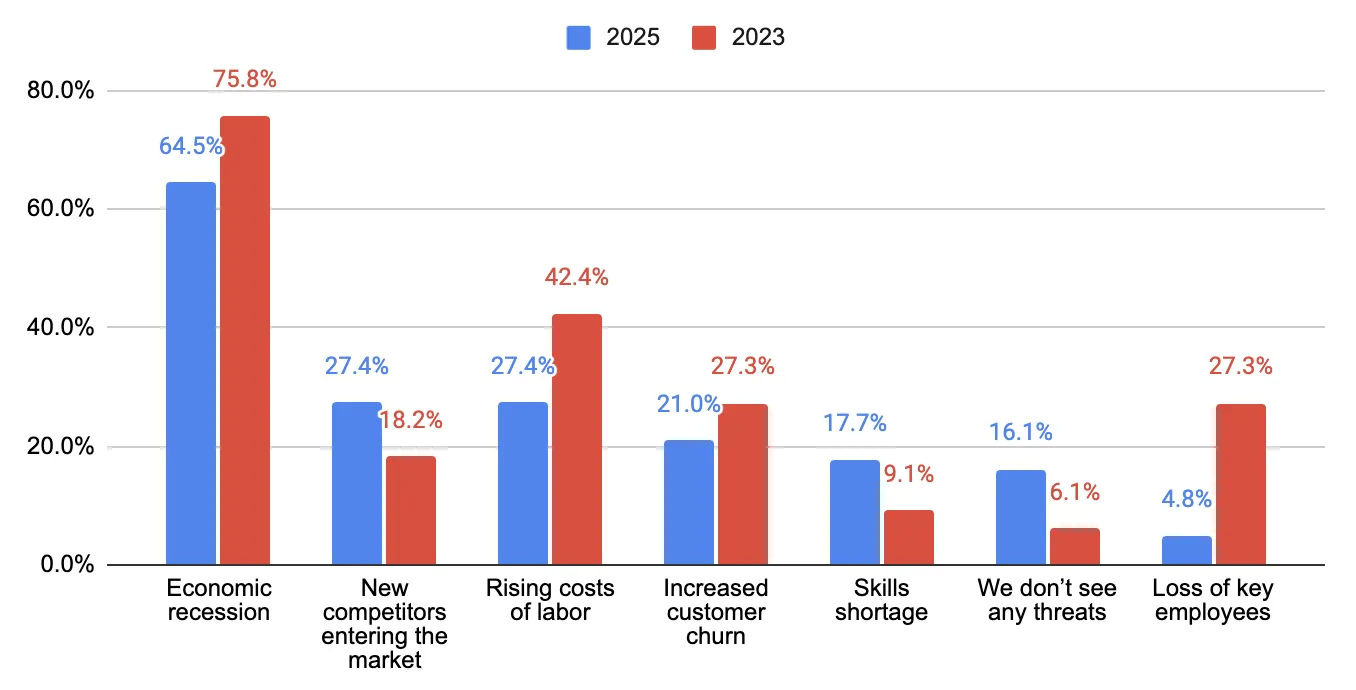
This chart provides information on the dynamics of threats respondents expect in the year. It shows percentage point changes in perceived business threats from 2023 to 2025.
Decreasing concerns:
- Loss of key employees: The most significant drop is in the concern over losing key employees, decreasing by 22.5 percentage points from 27.3% in 2023 to 4.8% in 2025.
- Rising labor costs: A 15.0-point decrease (42.4% to 27.4%) indicates reduced labor cost pressure.
- Economic recession: While staying dominant, concern about economic recession decreased by 11.3 points from 75.8% in 2023 to 64.5% in 2025, indicating that the market has become more stable than it was a year ago.
- Increased customer churn: A 6.3-point drop (27.3% to 21.0%) reflects a slightly more stable working environment.
- We don't see any threats: A 10.0-point increase from 6.1% to 16.1% implies that more companies felt more stable in the current IT service market.
Increasing concerns:
- New competitors entering the market: A slight 9.2-point rise from 18.2% to 27.4%.
- Skills Shortage: A slight 8.6-point increase from 9.1% to 17.7%.
Key trends:
- The decrease in two concerns: Economic recession concerns (-11.3 points) and rising labor costs (-15.0 points) – align with the previous insights about a growing market with decreasing competitiveness, suggesting a more stable economic environment.
- The rise in skills shortage concerns (+8.6 points) may be linked to the market's "rapidly changing and innovative" nature (61.3%), which requires new expertise. The concern isn't significant for now, but might become more acute soon.
- Increased confidence of participants who don't see any threats (+10.0 points) indicates a more manageable market.
Strategic recommendations:
- We are dealing with a stabilizing market environment. IT service providers should consider expanding their budgets for effective marketing channels since this market provides plenty of growth opportunities.
- Expertise and talents remain a driving force, so IT service providers should invest in talent acquisition to navigate 2025.
- Competition remains a significant concern, so service providers should analyze their marketing channels and stick to those that provide the maximum ROI in the competitive environment.
New marketing channels or tactics
This question had an open-form nature when we asked the respondents to describe the new marketing channels or tactics they would use in 2025. Here are the key findings based on their answers:
- Dominance of SEO and content: 43.5% of respondents emphasised the role of SEO and content marketing as a cornerstone of their strategies.
- Rise of AI innovation: 29.0% of respondents are planning to refer to AI-related tactics (29.0%) for automatic repetitive tasks and providing great personalization to their clients.
- Social media rebound: Despite past underperformance, 24.2% of respondents show great interest in social media and influencer marketing. They plan to leverage community engagement and brand visibility to stay competitive in the market.
- Experimentation with emerging channels: 8.1% of respondents highlighted that they are going to use niche tactics to reach their clients.
Overall, providers plan to prioritize SEO and AI-driven tactics to enhance personalization and address the lead generation challenge. Social media and paid campaigns require further refinement to overcome past disappointments, while networking and events can strengthen differentiation. Experimentation with emerging channels should be measured to assess ROI, especially during the economic recession.
Conclusion
Key takeaways:
- Content marketing and SEO remain the dominant and most effective channels, showing both wide adoption and consistent results.
- Trust-based methods like referrals and PR prove reliable, with high effectiveness and low disappointment.
- Social media, referral platforms, and email underperform, despite continued investment.
- The market is perceived as highly competitive but more manageable than in 2023, with fewer companies citing critical threats.
- Lead generation has become easier, but customer acquisition remains costly.
- AI is gaining traction as a personalization and automation tool in marketing IT services.
- Expertise and quality outweigh price in purchase decisions, reinforcing the value-over-price mindset.
Strategic recommendations:
- Double down on high-performing channels like content marketing, SEO, referrals, and networking/PR - these offer the best ROI and lowest disappointment rates.
- Refine underperforming channels such as social media and email by improving targeting, personalization, and messaging relevance.
- Reassess investments in referral platforms and PPC; prioritize those with proven ROI and align spend with measurable outcomes.
- Invest in brand and expertise visibility through case studies, certifications, and thought leadership to shorten sales cycles and boost trust.
- Strengthen differentiation and positioning to stand out in a still-competitive but stabilizing market.
- Embrace AI tools for personalization and automation, especially in content, outreach, and lead nurturing.
- Monitor acquisition costs closely and optimize strategies to improve conversion without over-reliance on paid traffic.
By following these recommendations, software development companies can increase their chances of success in the competitive software development industry.
Some of the companies that participated in the survey:
HighTech Kaunas Cluster, The Digital WOW, FORBMAX, Enozom, Beyond Intranet, Softellar, Cloudester Software, ICTS Custom Software, MediaOfficers, Profinit, Parachute Design, X3 Marketing, Teez Agency, Content Spotlight, Sigli, DeSmart, Testfort, PRAS, Dev-Story, flowdit, TheCodeWork, Reenbit, Spotverge, Sailing Byte, Drupfan, ASD Team, The VP Techno Labs, Halyard Consulting, Celestial Infosoft, Cabot Technology Solutions, Aetherius Solutions, Zaavia, CodeRiders, TestDevLab, Vervali Systems, Novumlogic Technologies, Flashyminds, MOOD UP, Sailotech, launchOptions, Digital4design, Elinext, QArea, Masu Business Software Solutions, CleverDev Software, Usetech, Magic Web Services, Silk Data, Axamit, Glorium Technologies, Talmatic.com